
Buttons and Controls
This section describes the interface and various regimes and tools available in the program. The tasks that Oufti performs are organized into several groups represented by different panels of the main window, which is shown on the image below. Each subsection describes in detail one of these panels.
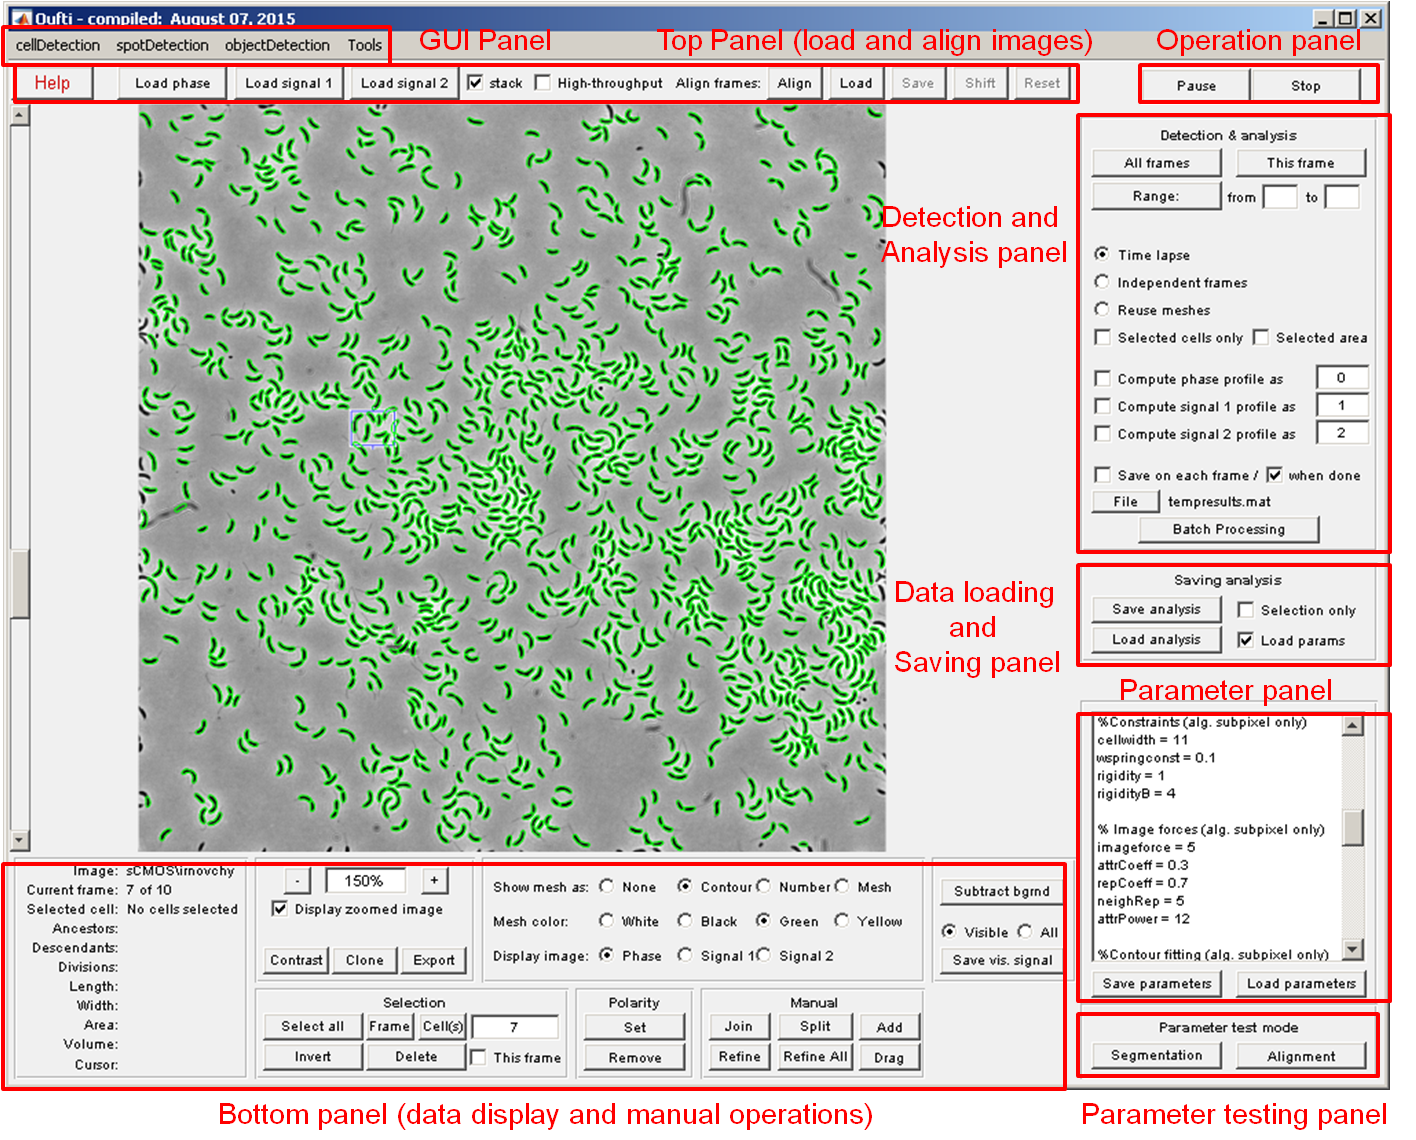
GUI panel
1. cellDetection: The default mode of the GUI, as shown above. Used for cellDetection.
2. spotDetection (see): Detects diffraction-limited fluorescent signals.
3. objectDetection (see): Identifies objects that are larger than the diffraction limit and does so with sub-pixel resolution.
4. Tools (see): Contains modules that help users visualize and analyze data after signal/image processing.
Top panel

Click here to see example of high-throughput analysis such as microfluidic time-lapse experiments.
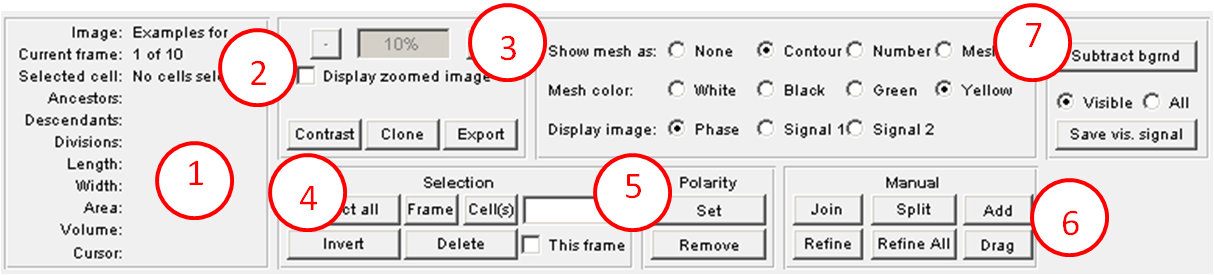
Bottom panel
Operation panel
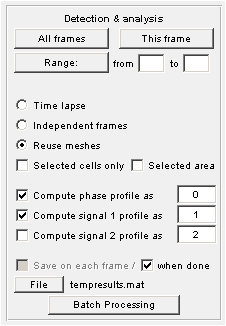
Detection and Analysis
Saving analysis
Parameters
Save parameters Load parameters
To see more information on each individual parameter, go to the parameters section.
Testing panel
Keyboard shortcuts
Shift of fluorescence images relative to phase
This regime allows the user to correct for any shift between the fluorescent images and the phase images used to determine cell outlines. The regime is called by pressing the keyboard f button. Note: The user must make sure the signal image is being displayed by pressing on the button in lower panel rigt next to phase. Once the regime is called, a menu appears, which allows the user to set the shifts in x and y direction( measured in pixels). Upon pressing shift, the meshes in the corresponding fluorescence signal image will be displayed shifted and the signal profile will be calclulated with the shifted values. This regime is empirical; different shifts will need to be applied manually and evaluated by the user to best determine when the fluorescent and phase images overlap correctly. The shift information can be saved by pressing the r or t (save/save as) buttons, and can be loaded by pressing the y button. This information is also saved with the meshes, but is not loaded automatically when the meshes are loaded.
- Delete - Delete selected cells
- i - Invert selection
- a - Select all cells
- g - Select a group of cells (according to their numbers)
- Up - Go to the previous frame
- Down - Go to the next frame
- s - Save meshes
- l - Load meshes
- Enter - Finish manually adding a cell (in manually adding cell regime)
- Escape - Terminate manually adding a cell (in manually adding cell regime)
- Control+Z - Undo the last manual operation or deletion
- q - Save the list of selected cells to file
- w - Save As the list of selected cells to file
- e - Load the list of selected cells from file
- f - Set the shift of fluorescence images relative to the phase one
- r - Save the shift of fluorescence images to file
- t - Save As the shift of fluorescence images to file
- y - Load the shift of fluorescence images from file
Output Format
Oufti saves data in two formats; .mat and .out. The .mat format can readily be loaded in Matlab for further post-processing. The use of the .out format is for larger data sets. This format saves data in comma-delimited format and enables users to process large datasets (~5000 images) with greater speed. The .out format can also be loaded in MATLAB for further post-processing.
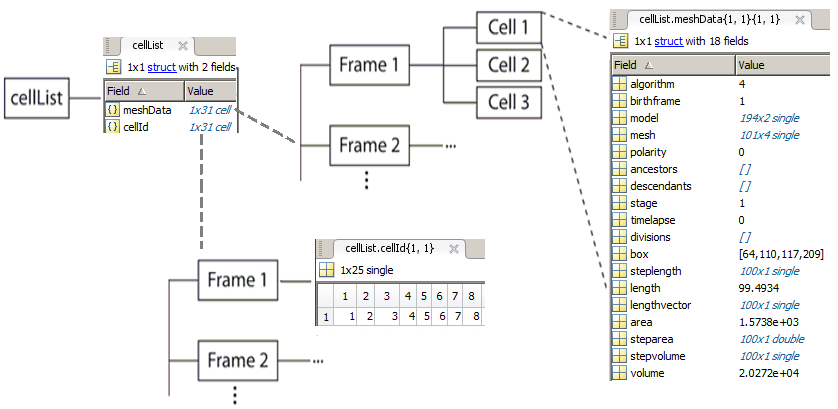
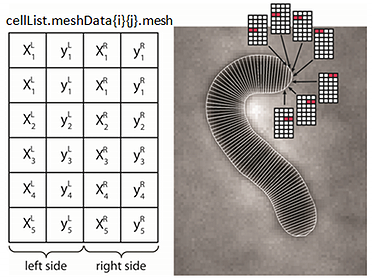
cellList format
The hierarchical organization of the variable is shown in the image. It is a MATLAB structure, with two cell array fields. The meshData field contains the cell information while the cellId field contains indices to the corresponding cell in a given frame. Each structure in a meshData array has several fields describing different properties of the biological cell.
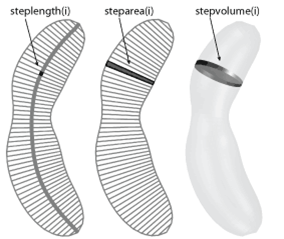
steplength/steparea/stepvolume
spots To see the spot structure click here
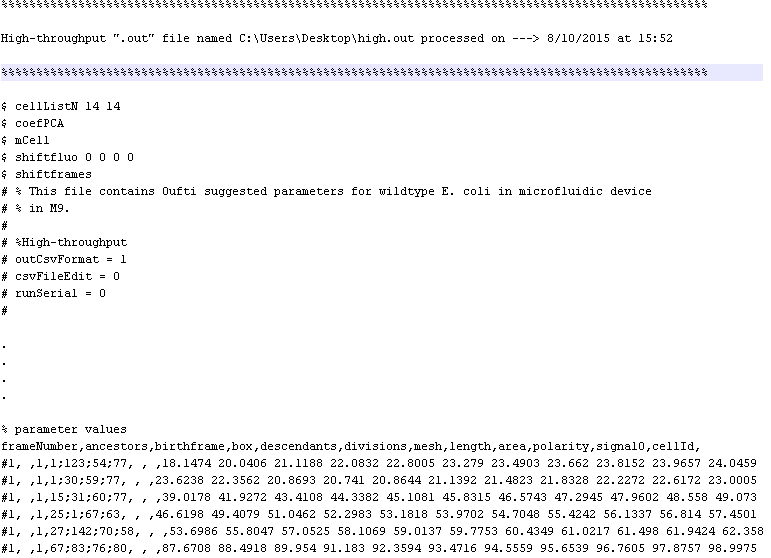
text format
.out is a comma delimited format and is used for larger image sets (>1000 images) or in instances where Matlab is not the intended application for post-processing analysis. The format can be re-loaded into Matlab as described in the High-throughput section and can also be loaded into other scripting languages used for data analysis such as R.
Parameters
Parameters are used to adjust cell detection. The effects of changing each parameter are described in more detail in the Adjusting Parameters section. Most of the parameters are numeric, with logical parameters as 1=yes and 0=no. Algorithm 'subpixel' is used for sub-pixel detection of contours while algorithm 'pixel' is used for pixel-based analysis.